Reports
Envitech Europe
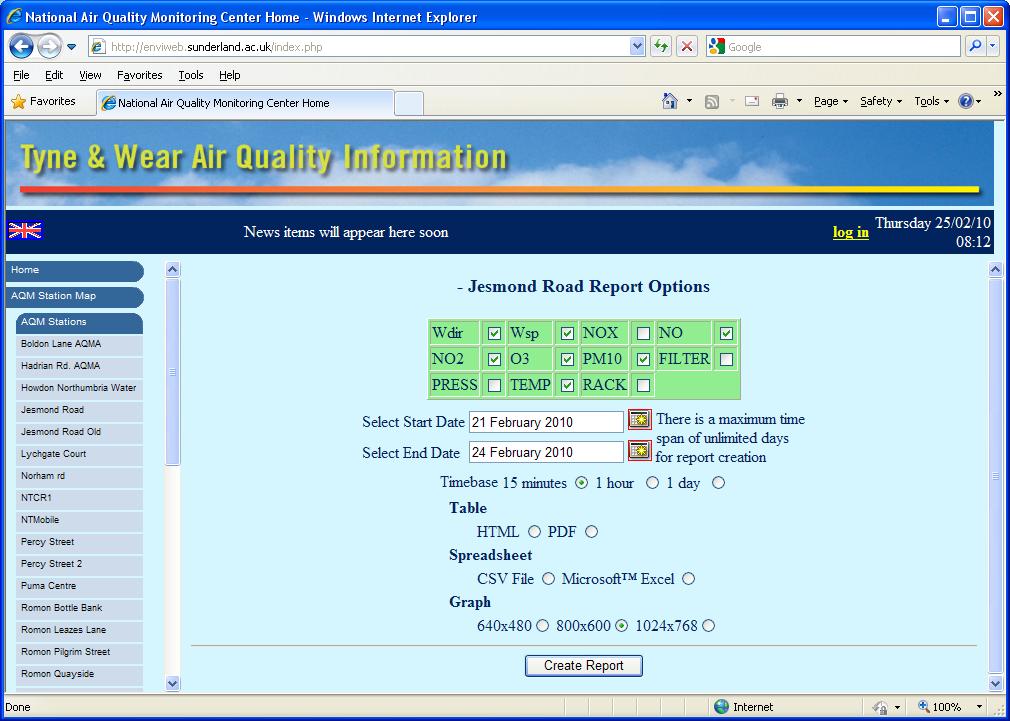
It is possible to create a report for a AQM/CEM station, it is first necessary to enter the reporting parameters using the parameter entry screen that appears after clicking on the relevant text from the Station Summary Information screen.
The parameter entry screen is used to select the channels which will be included in the report, the reporting period and frequency and the format of the report to be produced. Each channel to be reported is selected by use of the check-box entry. Check a channel to include it and clear the check-box to exclude it from the report. When a date entry is required, a pop-up window is displayed to allow a date to be selected by reference to a more familiar calendar image.
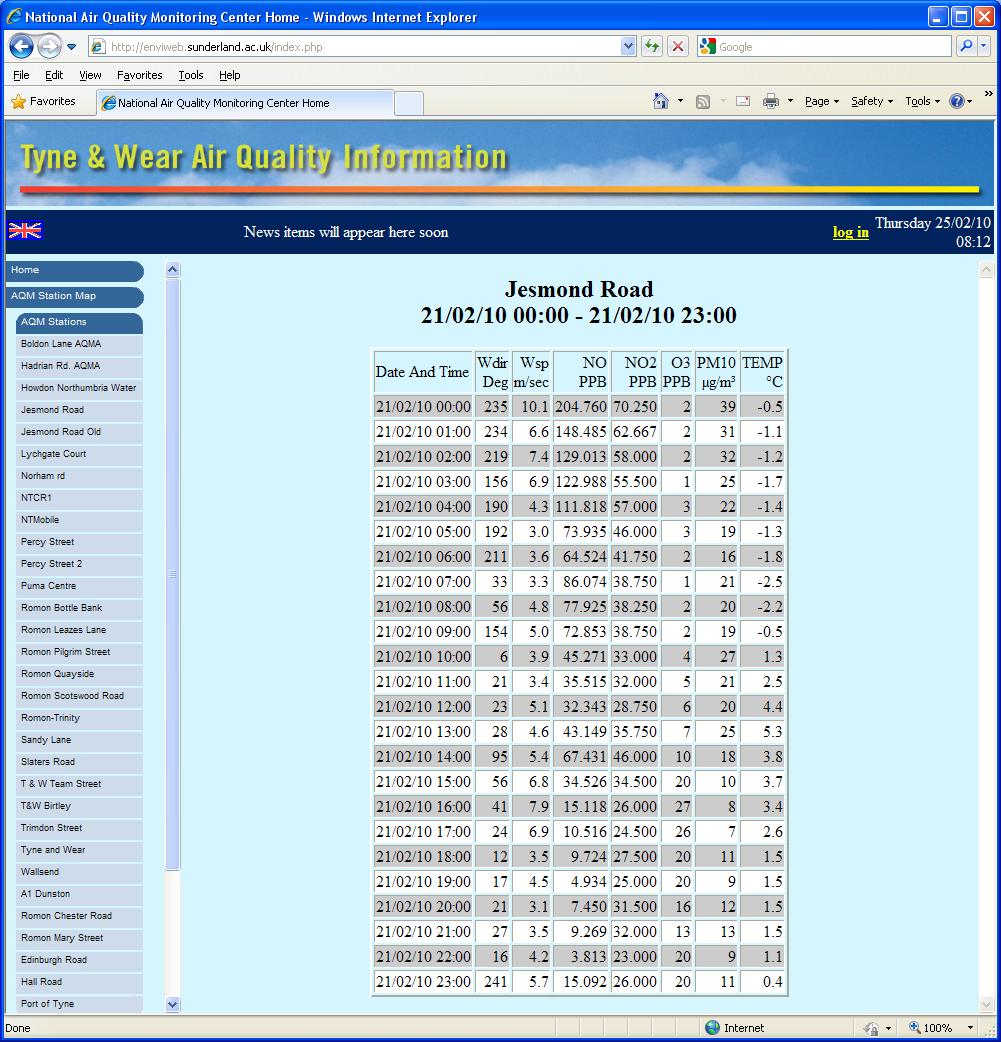
The following image is an example for station report in Table format, from the Envitech Europe EnviWeb site of Sunderland, UK.
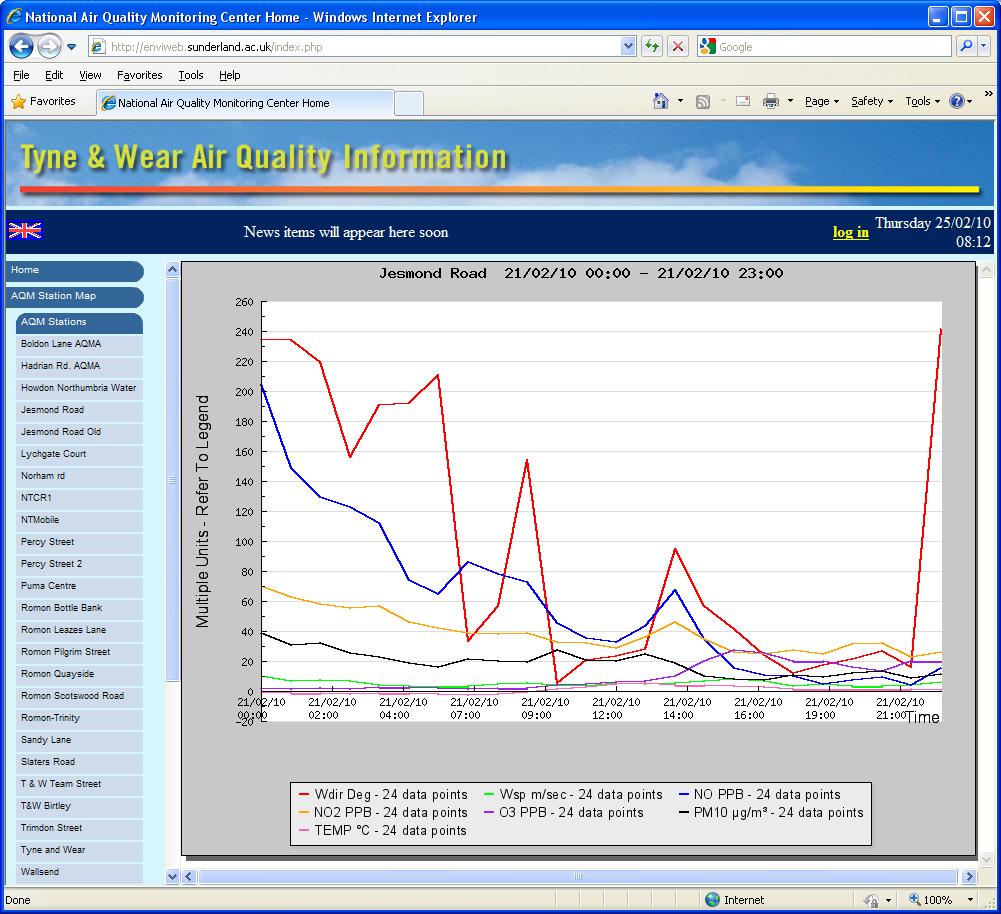
A selection of graph image sizes are available for selection by use of the radio buttons. The resulting graph file will be of the size selected. The image is initially displayed in the data area, from where it can then be saved locally by the Envitech Europe EnviWeb site visitor.
The following figure is a graphic example for the same report that was shown in the Table Report Type tab.
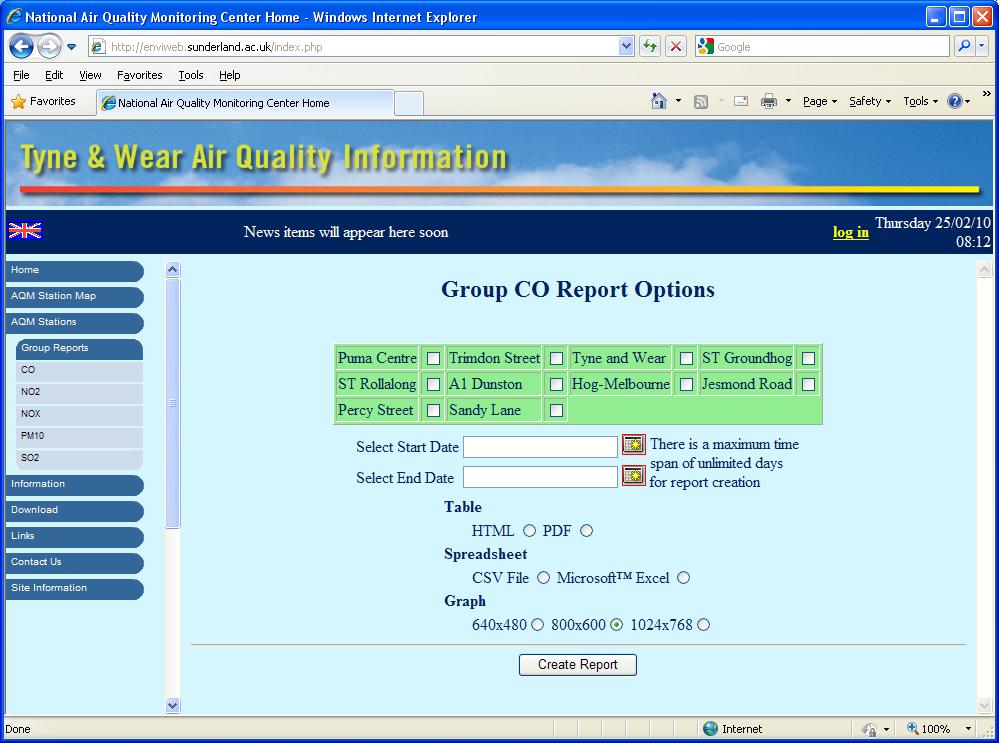
Envitech Europe EnviWeb site offers a report of pre-configured groups monitors from several stations. The site administrator should configure these group of monitors that will appear after click on the Group Reports tab from the main menu. Selecting one of these groups (that will be named after the common monitor's name) will display the group report dialog box. The report itself is similar to the Station Report and including tabular and graphical presentations.